A familiar frustration
Anyone who follows Mid-Atlantic weather has felt it. A day that looked certain on paper — SPC outlook, loaded dewpoints, a trough approaching — collapses into a quiet afternoon. Storms fire to the west, to the north, sometimes just across the Potomac. Maryland stays dry.
For years, forecasters and weather enthusiasts attributed these failures to the usual suspects: bad timing, a boundary that stalled, initiation that just never sparked. What was missing was a systematic explanation — a mechanism that could account for why Maryland in particular seems to underperform its thermodynamic potential so frequently in spring.
This study proposes and tests one: the Mid-Atlantic Moisture Cap (MMC), a layer of dry air sitting roughly 10,000 feet above the surface that acts as a thermodynamic lid on convection. Even when the lower atmosphere is warm, humid, and charged with instability, the MMC can quietly strangle storms before they ever get going.
Even when the lower atmosphere is loaded with energy, a dry layer overhead can quietly strangle storms before they ever get going.
Mid-Atlantic Moisture Cap hypothesisWhat is the Mid-Atlantic Moisture Cap?
The MMC is not a textbook warm nose — the classic elevated mixed layer that forecasters learn about in association with Great Plains convection. It is subtler. It operates through a different mechanism: dry mid-level air (roughly 700 hPa, or 10,000 feet) that entrains into rising parcels, evaporatively cools them, and reduces their buoyancy before they can reach the heights needed for deep convection.
The key signature is the 700-hPa dewpoint depression — the gap between temperature and dewpoint at that level. When this gap is large (above 15°C in the most suppressed cases), the mid-level air is too dry to support sustained updrafts. Parcels rise, mix with the dry environment, and collapse.
The secondary signature is the MLCAPE/MUCAPE ratio — a measure of how much of the column's most unstable potential energy is actually accessible to the mixed layer parcel near the surface. In a well-mixed column, this ratio approaches 1.0. When the MMC is active, dry mid-level air effectively caps the mixed layer parcel well below the most unstable level, and the ratio collapses — sometimes to 0.1 or lower.
The data
To test whether the MMC suppression ratio meaningfully separates event days from bust days, we assembled 22 years of data from three sources.
Hail events came from the NCEI Storm Events Database — every severe hail report (≥1.00 inch) logged in Maryland between 2004 and 2025, aggregated to 208 distinct event days.
Bust days required three conditions to qualify: the Storm Prediction Center must have issued a Marginal or higher categorical outlook (MRGL+) covering Maryland that day; the IAD 12Z sounding must have shown a Most Unstable CAPE of at least 1,000 J/kg; and no severe hail must have been reported anywhere in Maryland. Of 717 candidate bust days, 307 met all three criteria.
Thermodynamic profiles came from the 12Z radiosonde launched daily from Dulles Airport (IAD), retrieved from the University of Wyoming upper-air archive. Sounding parameters were computed using MetPy.
Analysis population — pre-registered filters
The primary analysis was restricted to a physically motivated population before any statistical tests were run:
- Months: April, May, June — the MMC transition season
- MUCAPE ≥ 1,000 J/kg — ensuring the atmosphere was genuinely loaded
- 700-hPa Td depression ≥ 5°C — confirming the MMC regime was present
This yielded a final analysis population of 37 days: 14 event days and 23 bust days. The statistical test was the one-tailed Mann-Whitney U (bust < event for the suppression ratio).
The result
The primary finding: on event days, the MLCAPE/MUCAPE suppression ratio had a median of 0.507. On bust days, it was 0.291. Bust days showed significantly lower ratios (p = 0.047, Mann-Whitney one-tailed), with a medium effect size (rank-biserial r = 0.335) and an AUC of 0.668.
In operational terms: on days when hail occurred, the mixed layer parcel was capturing roughly half the column's most unstable potential energy. On bust days, it captured less than a third. The difference is the MMC at work — dry mid-level air systematically undercutting the surface layer's access to the instability overhead.
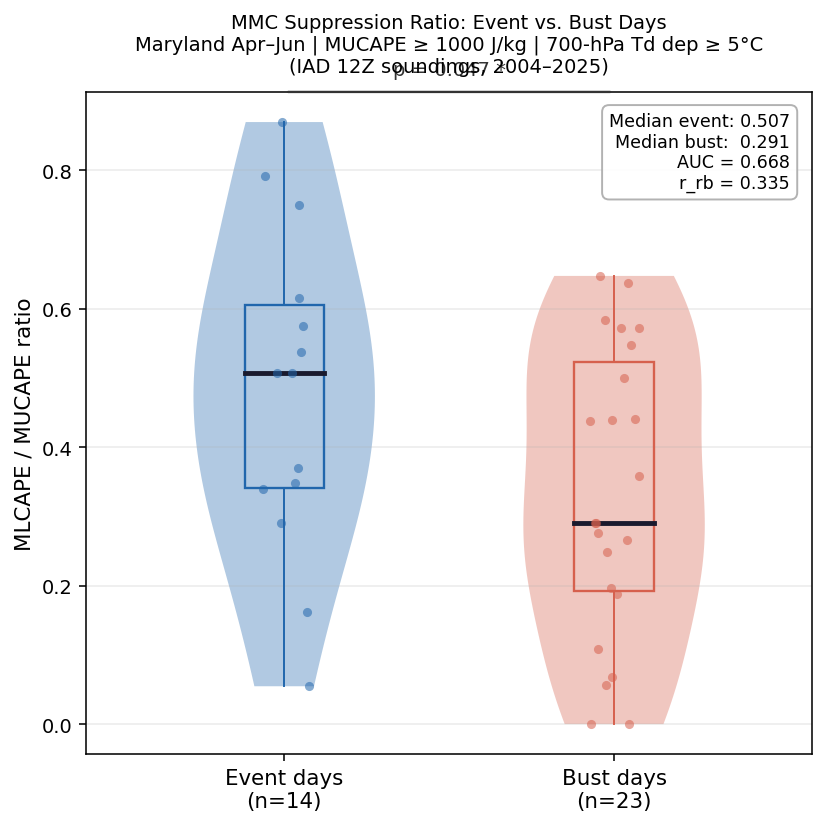
Primary result. Distribution of the MLCAPE/MUCAPE suppression ratio on Maryland hail event days (blue) vs. bust days (red), April–June 2004–2025, restricted to MUCAPE ≥ 1,000 J/kg and 700-hPa Td depression ≥ 5°C. Bust days show significantly lower ratios (p = 0.047). Each point is one day; horizontal bar is the median; box spans the interquartile range.
The contrast that matters
Perhaps as important as the filtered result is what happened without the filters. When the same test is applied to the full, unfiltered dataset — all months, all MUCAPE values — the p-value is 0.875. The signal disappears entirely.
This contrast is itself a finding. The MMC suppression signal only appears when you are actually in the MMC regime: a loaded column, a dry mid-level layer, the spring transition season. Finding it only within a physically coherent subset confirms that the mechanism is real and regime-dependent.
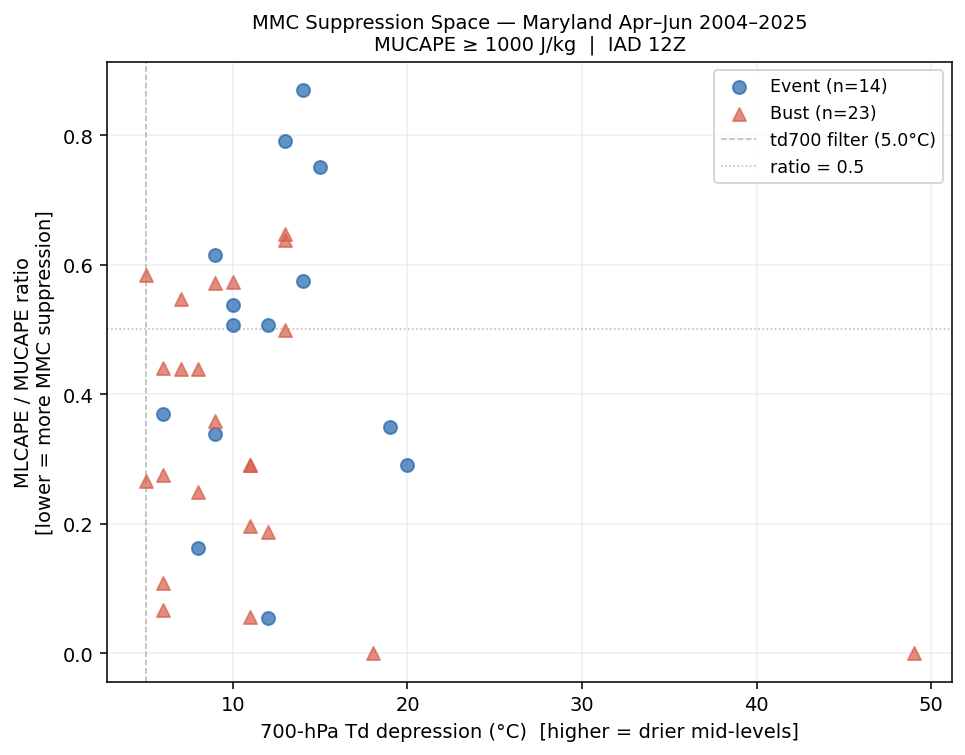
The MMC suppression space. Each point is one day in the analysis population, plotted by 700-hPa dewpoint depression (x-axis) and MLCAPE/MUCAPE ratio (y-axis). Event days (blue circles) tend to cluster toward higher ratios; bust days (red triangles) toward lower.
How well does it predict?
The ROC curve (Figure 3) shows the suppression ratio's ability to distinguish bust days from event days as a binary classifier. An AUC of 0.668 means that if you randomly selected one event day and one bust day, the bust day would have a lower suppression ratio roughly two-thirds of the time. As a screening diagnostic — a way to flag "this looks like an MMC day, discount your CAPE" — an AUC of 0.668 is meaningful and operationally useful.
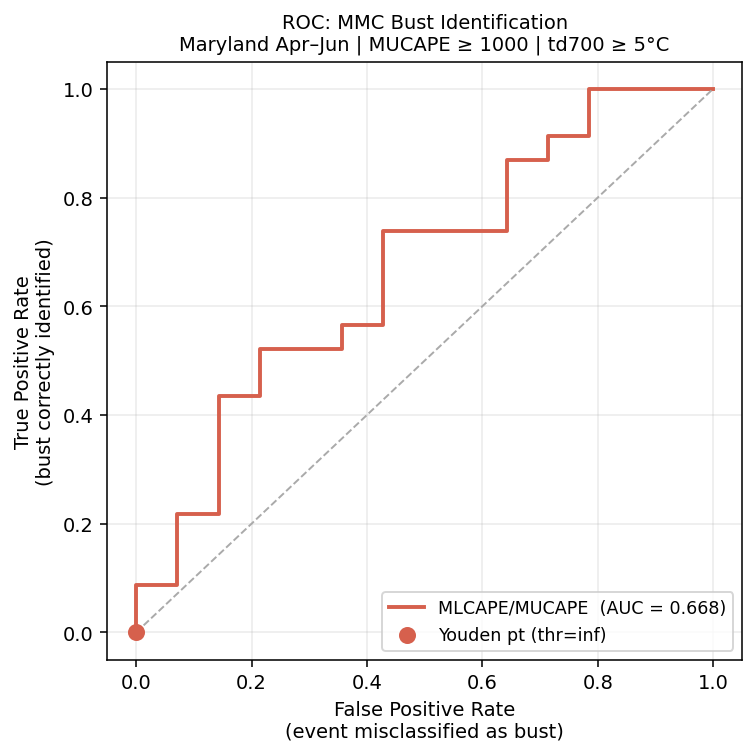
Classifier performance. ROC curve for the MLCAPE/MUCAPE ratio as a univariate bust classifier. AUC = 0.668. The diagonal dashed line represents chance performance (AUC = 0.50).
When in spring is the signal strongest?
The MMC suppression signal is present in May and June but essentially absent in April. April convection in Maryland is predominantly synoptically forced — driven by frontal systems strong enough to overcome boundary-layer suppression. The MMC operates as a controlling factor primarily once the synoptic forcing weakens and convection becomes more dependent on boundary-layer thermodynamics — typically from mid-May onward.
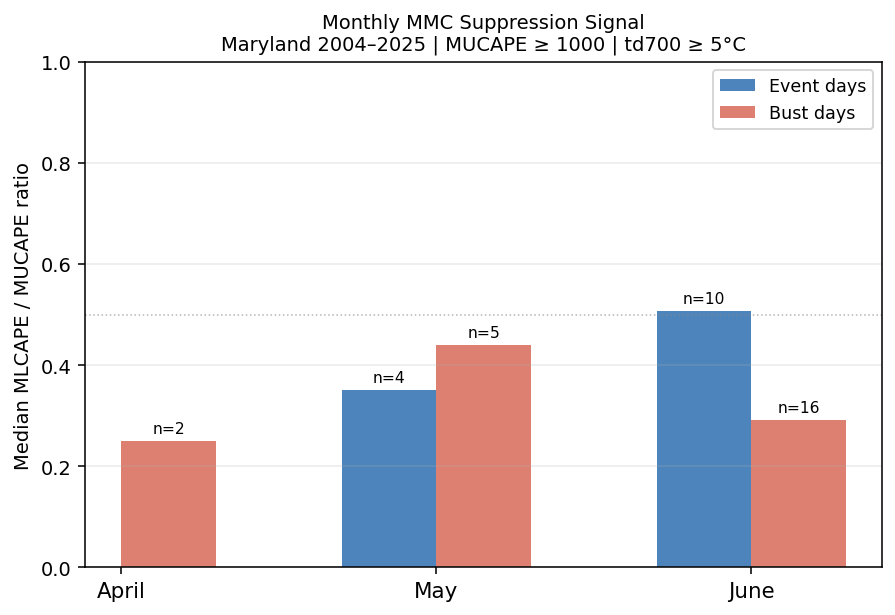
Seasonal structure of the signal. Median MLCAPE/MUCAPE ratio by month for event (blue) and bust (red) days. The gap grows from April through June, consistent with the MMC becoming the dominant convective control mechanism as synoptic forcing weakens.
What drought doesn't explain
Before focusing on boundary-layer thermodynamics, we tested whether Maryland hail frequency correlates with large-scale drought conditions — specifically, the convective-season Palmer Drought Severity Index (PDSI) averaged April through September.
The answer, across 22 years of data, is: it does not. The Pearson correlation between PDSI and annual MD hail report counts is −0.20 (p = 0.38). The Spearman rank correlation is −0.35 (p = 0.11). Neither is significant.
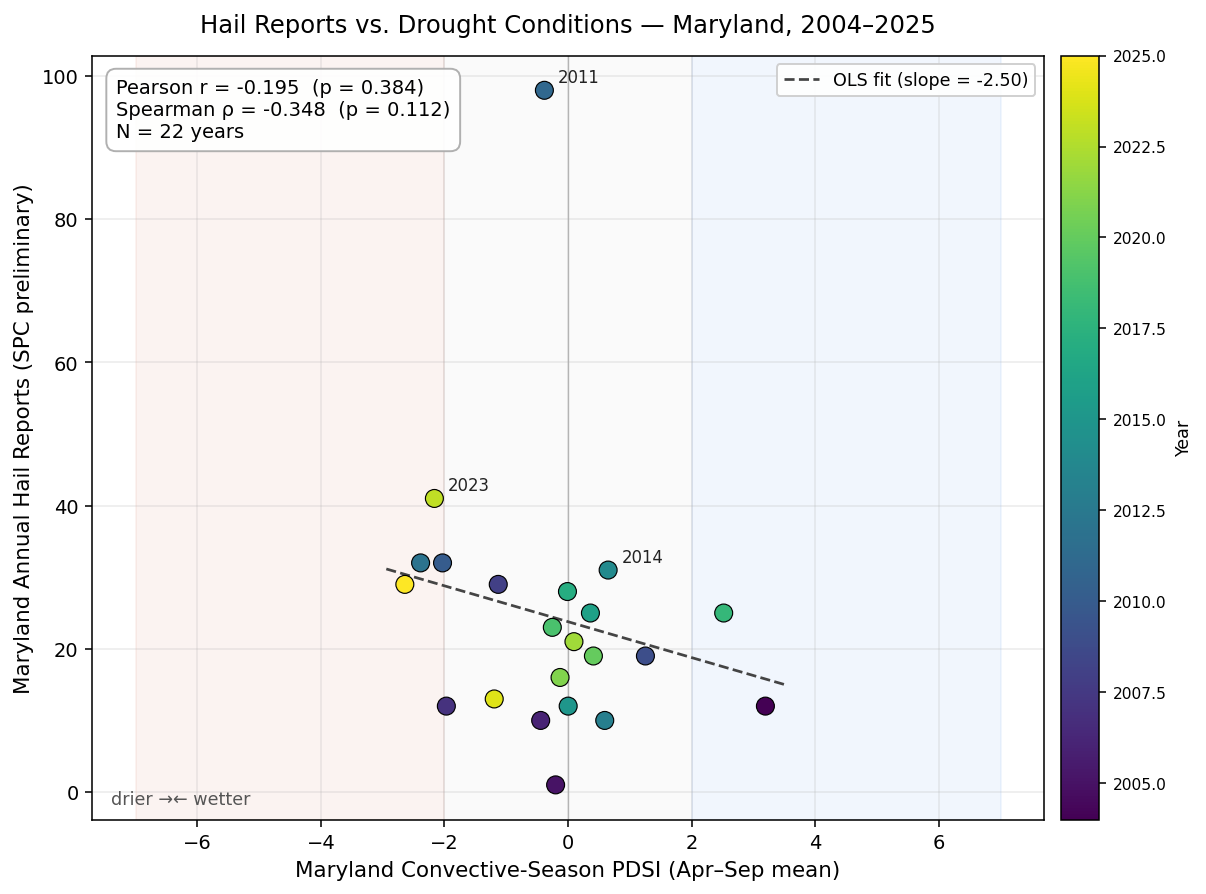
Drought vs. hail: no statistically significant relationship. Annual Maryland SPC hail report counts (2004–2025) plotted against convective-season (April–September) PDSI. The regression line slope is negative but not significant at α = 0.05.
This null result matters. It rules out a simpler explanation — that Maryland hail frequency is merely a function of regional moisture availability — and points toward day-scale thermodynamic structure as the operative variable.
Does it hold across Maryland?
A single-station sounding (IAD) raises an obvious question: does the suppression signal it captures reflect conditions statewide, or just the Dulles Airport catchment area in northern Virginia? To test spatial consistency, we split Maryland's hail record into three subregions and applied a strict county-level bust definition.
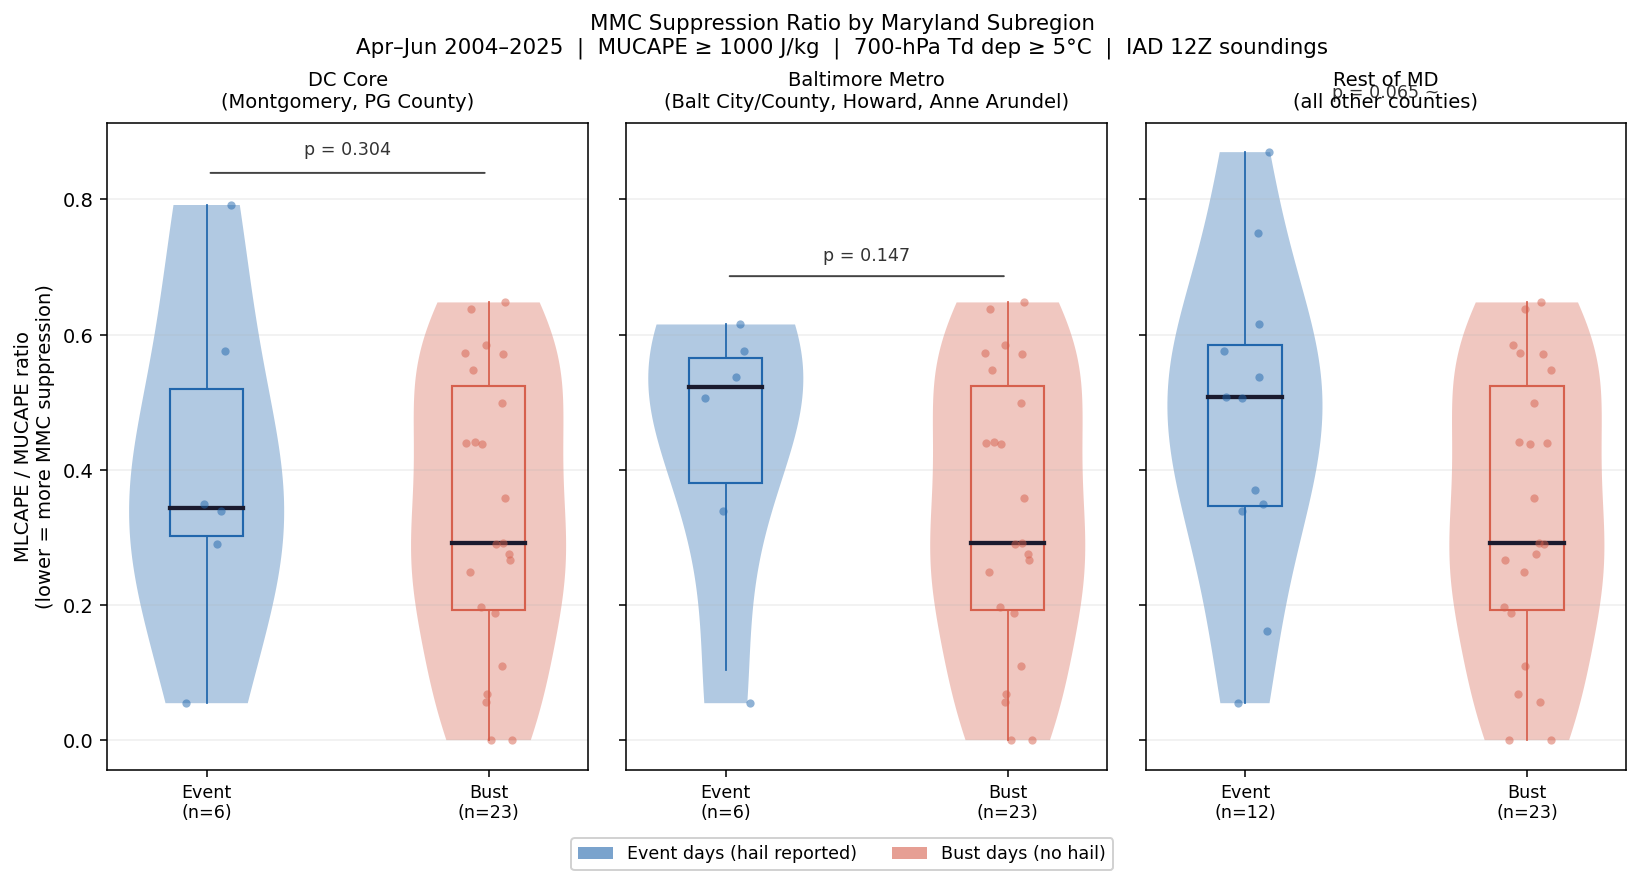
Spatial consistency of the MMC signal. MLCAPE/MUCAPE ratio on event vs. bust days, by Maryland subregion: DC Core, Baltimore Metro, and Rest of MD.
The most striking finding from the subregion analysis: the bust median is 0.291 in all three subregions. The same IAD sounding predicts bust conditions equally well across the DC suburbs, the Baltimore metro, and rural Maryland. The MMC, when active, operates as a regional lid rather than a local one.
The DC core is different on the event side — events there occur at a median ratio of just 0.34, with individual cases as low as 0.05. Something is generating convective initiation in Montgomery and Prince George's Counties even under suppression — most likely the persistent urban heat island and the Potomac/Anacostia convergence zone.
What this tells us
Caveats and future work
This study has real limitations that should be stated plainly. The sample is modest: 14 event days and 23 bust days in the primary analysis. A p-value of 0.047 on a sample this size is a preliminary result, not a settled one. The finding warrants replication and extension.
The 12Z IAD sounding is a morning observation, typically 6–10 hours before afternoon convection. Future work with afternoon reanalysis profiles (ERA5 or RAP analysis at 18–21Z) would address this limitation directly.
The DC core anomaly — events firing at unusually low suppression ratios — deserves its own investigation. If urban heat island forcing and boundary layer convergence are enabling convective initiation in Montgomery and Prince George's Counties under MMC conditions, that has direct implications for operational forecasting of the I-95 corridor.
The MMC is not just a forecasting curiosity. It is the reason Maryland underperforms its thermodynamic potential — and now we have the data to say so.
ExtremeWeather — Mid-Atlantic Moisture Cap Research